Introduction:
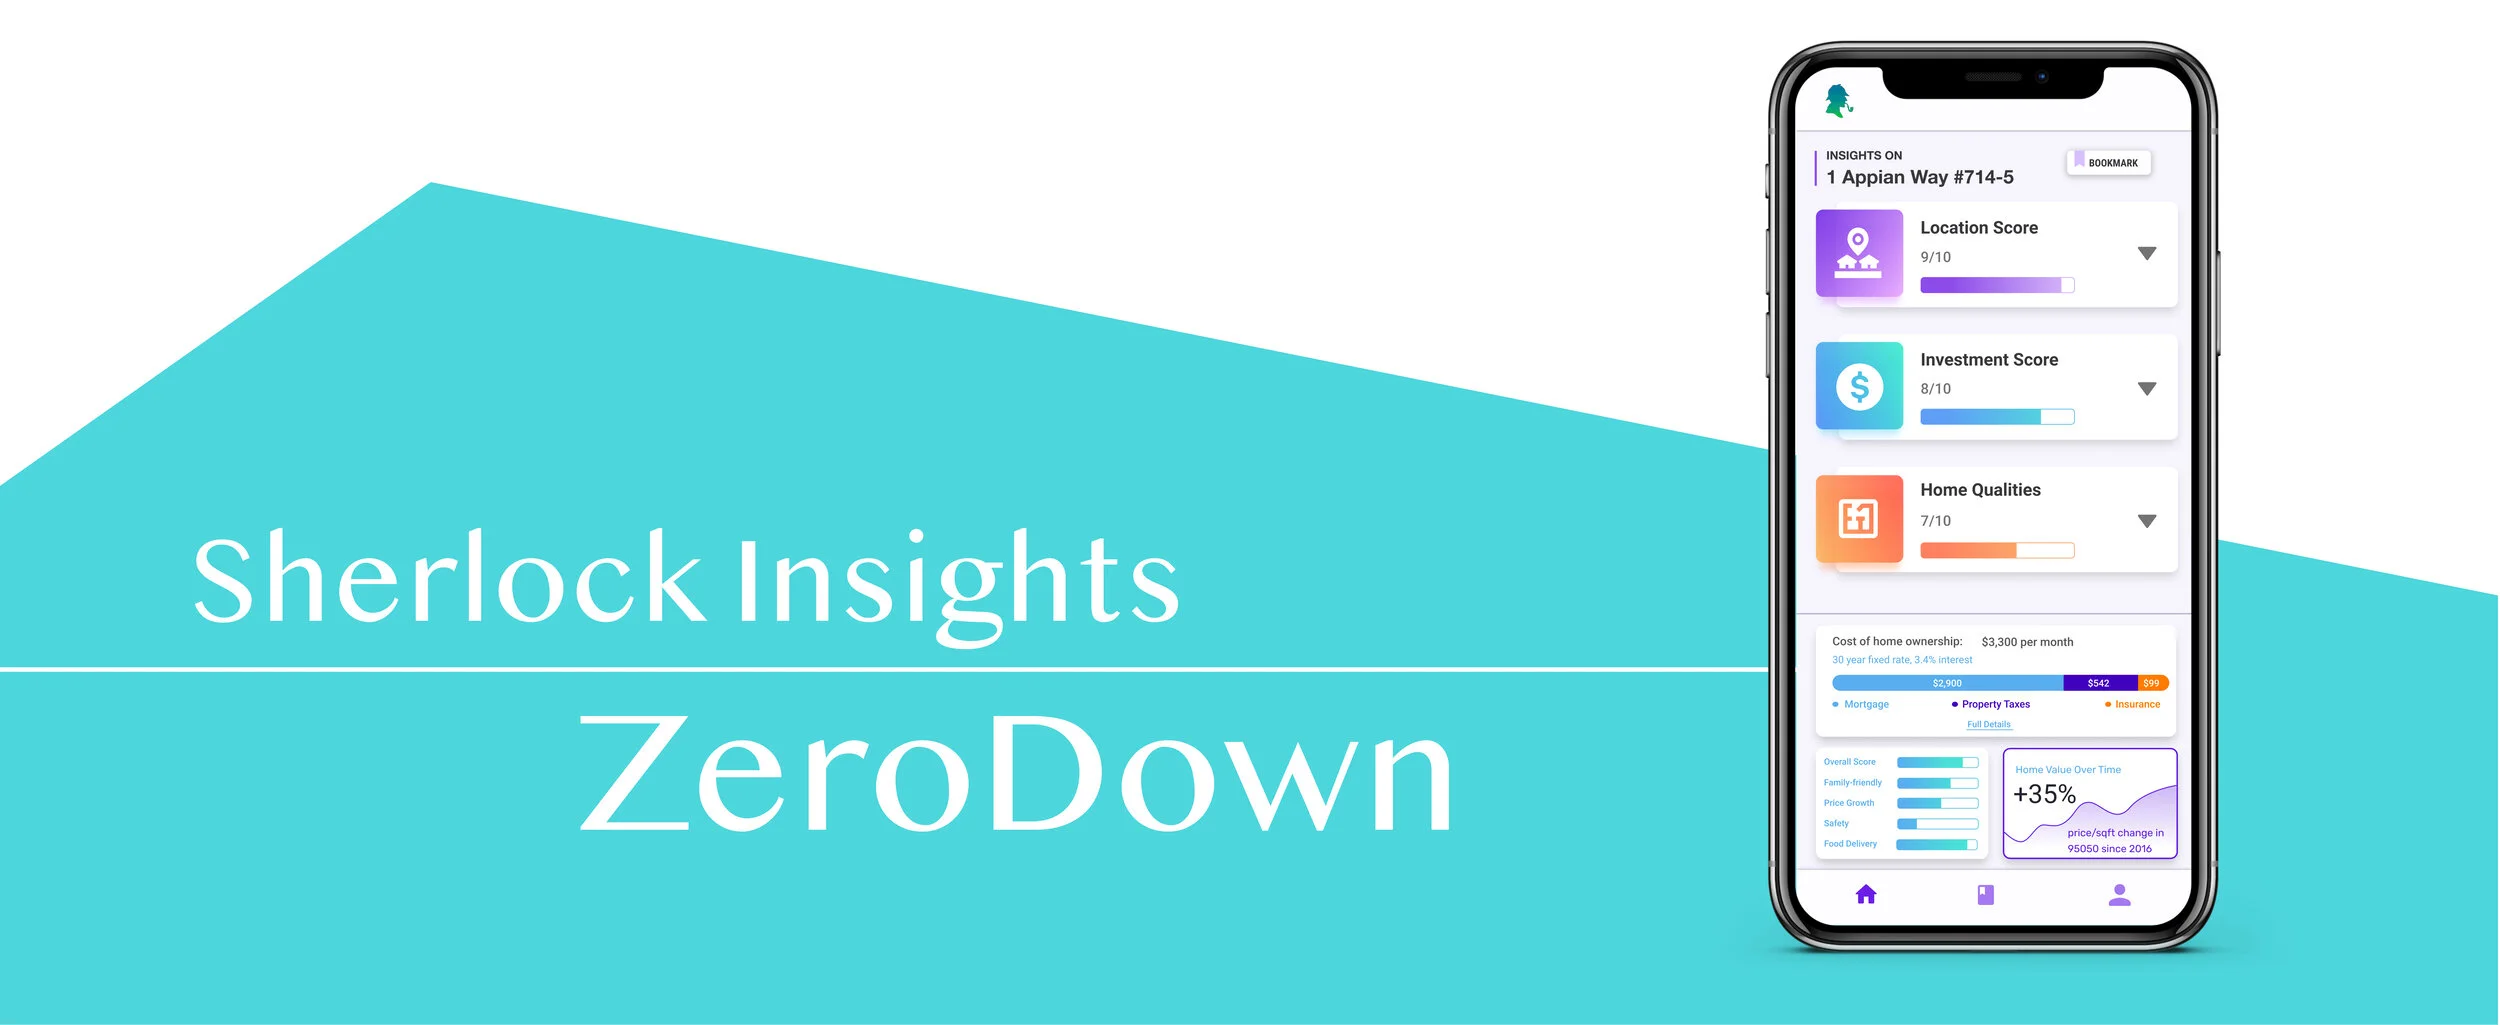
At ZeroDown I was tasked with designing the “Sherlock” Insights page for a mobile platform. The Sherlock page gives a wide array of information specific to each home. Examples include a homes price compared to the areas median, the types of amenities surrounding a home, unique characteristics of a house, and much more.
The Challenge:
Take 10 insights that were provided to me (all full sentences) and data containing cards (for me to decide what should be included and how many) and organize them onto a single mobile page. Nothing could be left out, everything had to be both easily accessible and intuitive, and finally, the UI had to be beautiful. This task had to be completed within 6 hours.
The Insights
Below are the 10 example insight sentences that were required to be included in the design. As you’ll see, it is a lot of information for a mobile design.
21 electric car charging points within a 5-minute driving distance. That's more than the median in the metro area.
(__) is safer than (__)% of the cities in the state. Based on property and violent crimes per 1000 residents.
300+ restaurants deliver over 30+ different cuisines to this home via Doordash. Enjoy super fast delivery!
3 A+/A/A- rated public middle schools in the district
San Francisco Caltrain (Caltrain), Powell St. (BART) stations in walking distance
Only house with a fireplace among 31 similar listings
1,024 sqft smaller lot among 19 similar listings with median lot size of 2,048
Listing price is lower than last sold price
This home's expected price per sqft ($792/sqft) is 4% above the median price per sqft of $760/sqft for similar homes nearby.
Similar homes in the area sell for 3 % - 6 % above list price.
Brainstorm/Ideate
Brainstorming
Since I had so little time to complete this assignment, I decided that it would be prudent to be really specific in my brainstorming. This would ultimately save me time in sketching and prototyping.
Sketch
A quick sketch of the design:
Prototype
Final Prototype
The Design
1.) Categorized Drop Down Tabs
Each tab has a specific theme which certain insights fall under.
The themes are based around a scoring system. An overall score gives the user an immediate evaluation so the user has an objective understanding of a homes qualities. Both a numerical value and a bar meter are offered to maximize this impact.
2.) Data Cards
I chose to use 3 data containing cards – it is an ideal quantity that balances relaying important information without overloading the user.
Cost of Ownership card: after doing comparative/competitive analysis of similar companies (i.e. Zillow), I concluded that the most important data set is one that examines the actual cost of owning a particular home.
Bar Meter scores: offers users a quick evaluation of a multitude of home qualities.
Home Value Over Time graph: buyers want to know how a homes value will change over time. This card offers the user to extrapolate an estimate.
Conclusion
Conclusion
This was a small scale project that instilled confidence in my skills on a large scale way.
First, it required an ability to plan everything ahead. This is a seemingly basic task, but it is easy to cut corners and begin by prototyping when there is so little time, only to end up actually wasting time as there was no action plan. Careful planning requires patience rooted in delayed gratification, that in the end the product will be better for it.
In addition, I was affirmed in my ability to perform a given task efficiently and effectively. Deadlines are a constant reality, and being able to produce a high quality product without compromise in a small window of time is essential.


